Microsoft has started off strong again this week, surging more than 2.6 percent in late-day trading on Monday. Without any major news, Microsoft shareholders now find themselves up 7.9 percent in the past five trading days and 15.4 percent since the Black Monday crash on August 24.
While a Bank of America upgrade from Underperform to Neutral might partially explain why Microsoft recently found a bottom, Benzinga turned to the charts to see if there is a technical explanation for the aggressive bounce in share price.
Trading Channels
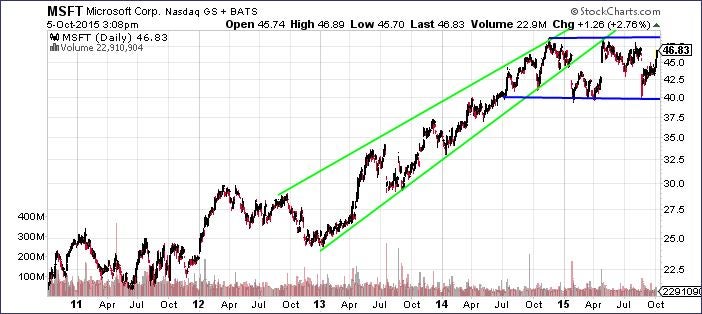
Since the beginning of 2013, Microsoft’s share price has climbed about 69 percent. From late 2012 to early 2015, the stock was trading inside a tight ascending channel, identified by the green lines in the chart below.

However, since breaking out of that channel in early 2015, Microsoft has been range-bound within a horizontal channel, indicated by the blue lines in the chart. The ceiling of this range is around $49, and the floor of this channel is in the $40 range.
Technical Bounce
The boundaries of this channel have both been tested…
Click here to continue reading
Want to learn more about how to profit off the stock market? Or maybe you just want to be able to look sophisticated in front of your coworkers when they ask you what you are reading on your Kindle, and you’d prefer to tell them “Oh, I’m just reading a book about stock market analysis,” rather than the usual “Oh, I’m just looking at pics of my ex-girlfriend on Facebook.” For these reasons and more, check out my book, Beating Wall Street with Common Sense. I don’t have a degree in finance; I have a degree in neuroscience. You don’t have to predict what stocks will do if you can predict what traders will do and be one step ahead of them. I made a 400% return in the stock market over five years using only basic principles of psychology and common sense. Beating Wall Street with Common Sense is now available on Amazon, and tradingcommonsense.com is always available on your local internet!


