In a new post, Slope of Hope contributor Tim Knight points out why he believes Apple Inc. AAPL 0.72% is headed lower following this week’s Q4 earnings report and could eventually dip below $75.
Knight included the following chart in his piece, which includes a giant shaded head-and-shoulders pattern, an extremely bearish technical topping pattern. He sees this pattern as an indication that the risk is currently to the downside for Apple.
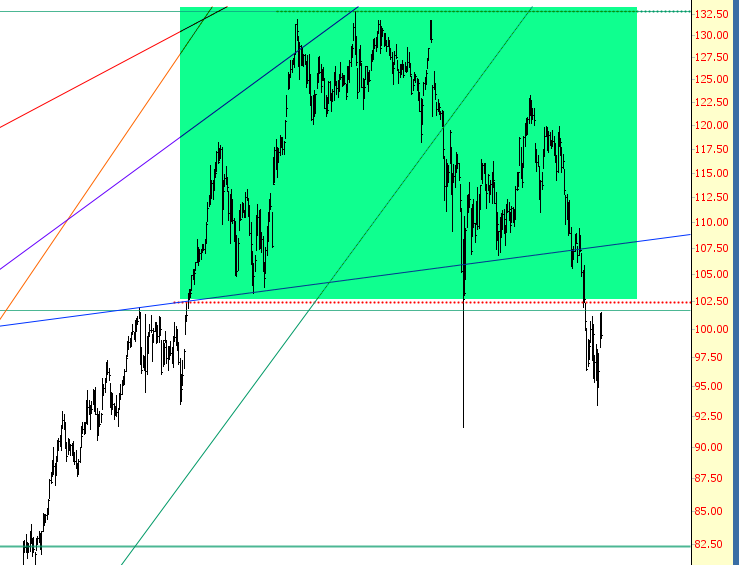
“I suspect that Apple is more likely to be down on Wednesday than up,” Knight wrote. “I further think that, in the months ahead, Apple is going to find itself at a place no one dare imagine: in the 70s.”
Knight compared…
Click here to continue reading
Want to learn more about how to profit off the stock market? Or maybe you just want to be able to look sophisticated in front of your coworkers when they ask you what you are reading on your Kindle, and you’d prefer to tell them “Oh, I’m just reading a book about stock market analysis,” rather than the usual “Oh, I’m just looking at pics of my ex-girlfriend on Facebook.” For these reasons and more, check out my book, Beating Wall Street with Common Sense. I don’t have a degree in finance; I have a degree in neuroscience. You don’t have to predict what stocks will do if you can predict what traders will do and be one step ahead of them. I made a 400% return in the stock market over five years using only basic principles of psychology and common sense. Beating Wall Street with Common Sense is now available on Amazon, and tradingcommonsense.com is always available on your local internet!


