There are a lot of people that are getting extremely nervous about the stock market lately, especially after the volatility from last week has already carried over to this week. While there’s no sure-fire way to know exactly when the market is making a reversal, there are ways to tell when it is breaking a pattern. But the first step in identifying a break in pattern is knowing how and where to look for a pattern. And yes, there will be charts today. I know how you all love charts.
In my book, Beating Wall Street with Common Sense, I devote an entire chapter to market psychology, including a branch of stock market analysis called “technical analysis.” This realm of analysis deals exclusively with making predictions about future stock performance based on past stock performance. One of the most basic elements of technical analysis is finding market trends. From my book:
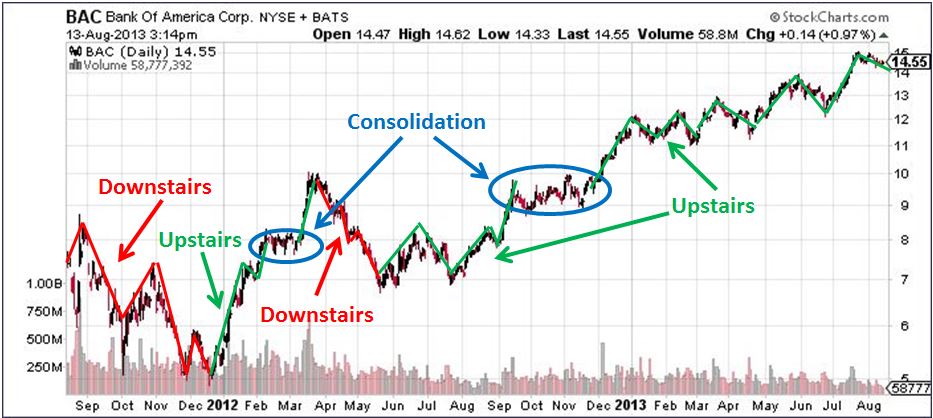
… stocks rarely move up or down in a straight line over an extended period of time. A typical directional trend looks almost like a staircase, with large moves in the direction of the trend followed by consolidation periods during which smaller moves in the direction counter to the trend occur. As a result, a typical uptrend will produce a series of peaks and valleys, each one higher than the previous one. If you imagine a side view of a staircase that goes up to a peak and then begins to descend down on the other side of the peak in the shape of a Christmas tree, the top step and the two steps on either side create the same general head and shoulders shape.
Consolidation phases are very important aspects of a typical trend. During an uptrend, small dips in share price on the way up allow shares of stock to change hands from old holders who are worried that they will lose their profits to new holders who were worried the stock price will continue going up so fast that they will never get an opportunity to buy at a decent price. This consolidation is very healthy for maintaining an uptrend because it replaces worried shareholders with enthusiastic ones. If a stock moves straight up over an extended period of time without any consolidation periods, it builds up a sort of selling “pressure” as more and more holders are ready to sell at the first sign of a dip. Therefore, instead of a healthy 3% drop of a normal consolidation phase, a much larger drop of 6 or 7% may occur. If this drop breaks the support line, the trend may then be destroyed all together, and technical analysts might sell the sock in mass.
After a typical consolidation phase, the shareholder base is “stronger” in a sense that they are less likely to sell as the stock moves to new highs. The cycle of new highs followed by consolidation phases repeats itself until there are not enough buyers remaining to drive the price higher and it cannot form a new peak that is higher than the previous one. This stage manifests itself as the right shoulder of the head and shoulders formation (the first lower peak), and signals the beginning of the downturn. Therefore, commons sense will tell you that it is not the patterns themselves that dictate the direction in the market; it is the patterns of psychology and activity in the market that forms the patterns. When I came to realize this point, I was finally able to accept TA as a useful trading tool. Examples of the staircase-like appearance of a stock chart and two clearly-defined consolidation phases can be seen in the chart of BAC below.
That Bank of America chart from my book is from a while back. Let’s take a look at a couple of recent charts. This first one is a three year chart of Wells Fargo, one of my largest holdings. This is a textbook example of a multi-year technical uptrend:
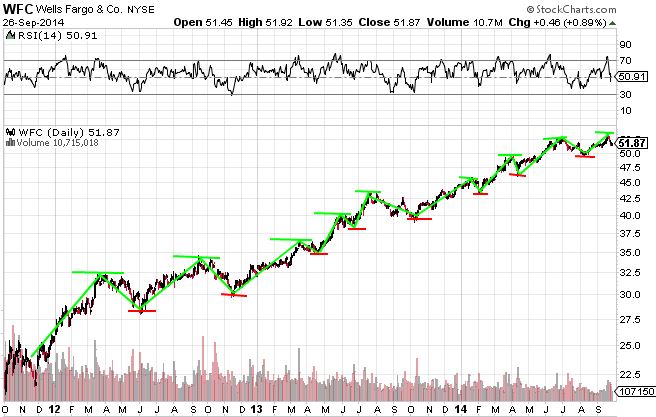
Notice how each successive peak is higher than the previous peak, and each successive trough is higher than the previous trough. That’s what gives the staircase appearance. Now take a look at this chart of Melco Crown Entertainment:
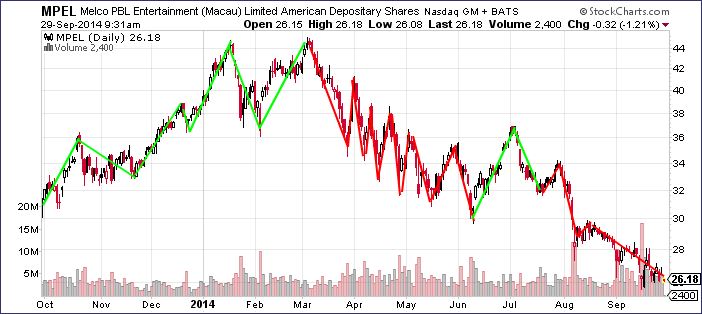
Earlier this year, Melco reversed a multi-year uptrend that had catapulted the share price from under $7.50 to $45 per share! What you’re seeing in this chart is the end of that upward trend and, after a “double top,” the beginning of a volatile downtrend. Again, notice the sequence of higher highs and higher lows and then the transition to the series of lower highs and lower lows. Readers of Trading Common Sense know my feelings about Melco as a long-term holding, so I’m not going to go into that today.
But these charts both show well-established trends. The real money is in quickly recognizing a change in trend in real time. Look at this chart of Apple:
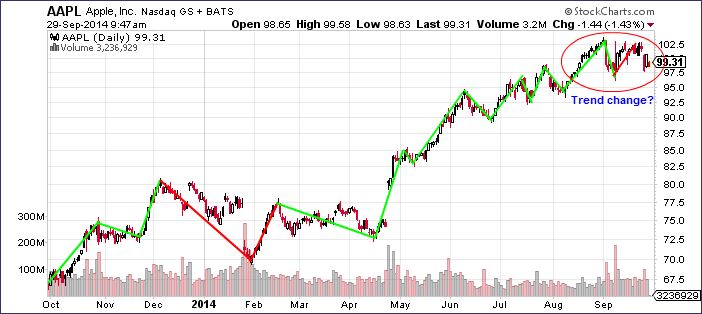
Now, honestly Apple’s last month or so of trading has been a jumbled mess, and this period may well just end up being an extended consolidation phase and not a trend reversal. Since Apple is my largest holding, that’s certainly what I’m hoping for. But this early recognition that something could be up makes me aware of what I need to be watching for in Apple’s chart in the near future.
And now the grand finale: the S&P 500.
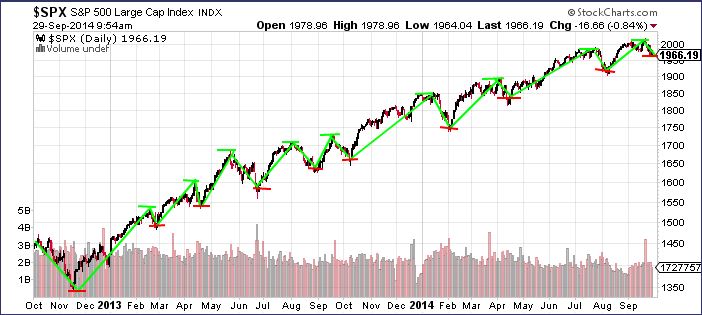
Is the stock market reversing its pattern? Maybe. I do believe a reversal is coming at some point, I just don’t know when. But as of right now, there’s absolutely no evidence of any kind of a reversal in the charts.
Sometimes the stock market is just completely unpredictable. You don’t have to be right 100% of the time to make a bunch of money. If you use common sense to put yourself in favorable positions and maintain enough discipline to limit the damage when you are inevitability wrong, you can be an extremely successful trader.
Want to learn more about the psychology of the stock market? Or maybe you just want to be able to look sophisticated in front of your coworkers when they ask you what you are reading on your Kindle, and you’d prefer to tell them “Oh, I’m just reading a book about stock market analysis,” rather than the usual “Oh, I’m just looking at pics of my ex-girlfriend on Facebook.” For these reasons and more, check out my book, Beating Wall Street with Common Sense. I don’t have a degree in finance; I have a degree in neuroscience. You don’t have to predict what stocks will do if you can predict what traders will do and be one step ahead of them. I made a 400% return in the stock market over five years using only basic principles of psychology and common sense. Beating Wall Street with Common Sense is now available on Amazon, and tradingcommonsense.com is always available on your local internet!

