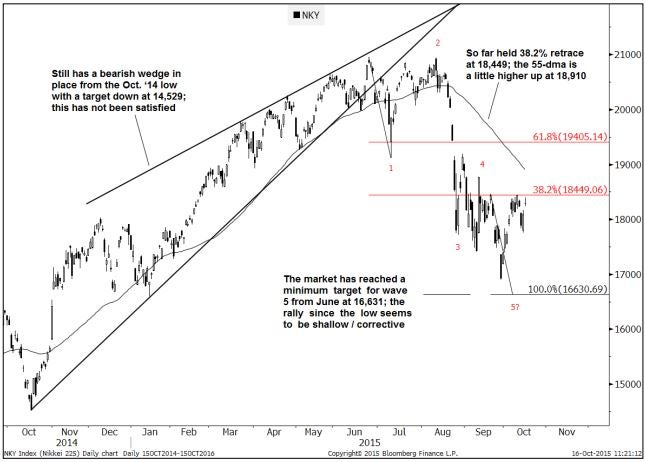
In a new report, Goldman Sachs includes several charts that technical traders should be watching in coming weeks. Here’s a closer look at six charts from the report.

The first chart is a short-term look at the S&P 500. Goldman notes that the critical level to watch for the S&P is the 2,025-2,039 region. The report notes that the resistance will likely be difficult to break, but that a move above 2,040 would certainly make the index look “more constructive.”

The next chart is a longer-term chart of the S&P 500. Goldman draws comparisons between the recent market breakdown and the breakdown that occurred back in late 2011. If the previous breakdown is, in fact, an appropriate comparison, the S&P 500 will be back on track soon enough.

Much of the recent market worry has been…
Click here to continue reading
Want to learn more about how to profit off the stock market? Or maybe you just want to be able to look sophisticated in front of your coworkers when they ask you what you are reading on your Kindle, and you’d prefer to tell them “Oh, I’m just reading a book about stock market analysis,” rather than the usual “Oh, I’m just looking at pics of my ex-girlfriend on Facebook.” For these reasons and more, check out my book, Beating Wall Street with Common Sense. I don’t have a degree in finance; I have a degree in neuroscience. You don’t have to predict what stocks will do if you can predict what traders will do and be one step ahead of them. I made a 400% return in the stock market over five years using only basic principles of psychology and common sense. Beating Wall Street with Common Sense is now available on Amazon, and tradingcommonsense.com is always available on your local internet!


