Apple’s stock has delivered a lackluster return in 2015 of -3.4 percent. Despite record profits and favorable valuation metrics compared to its peers, Apple’s chart looks extremely challenged heading into 2016.
Bearish Formations
Apple experienced a death cross back in August and dropped below its 50-day simple moving average (SMA) earlier this month. In addition, its early November peak at $123 fell well short of its previous peaks at around the $132 level in February, April and July.
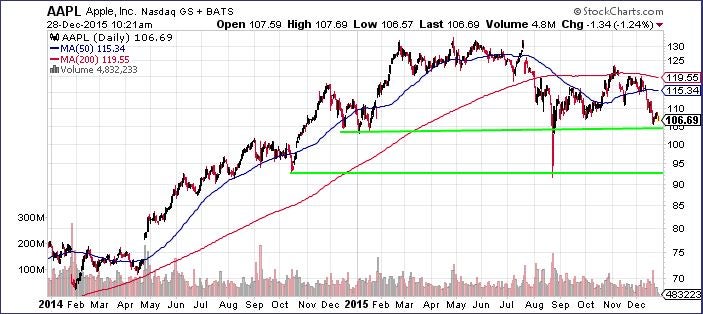
In fact, the triple top is an extremely bearish indicator in itself. As if there weren’t enough technical signals that the $132 level was a major market top for Apple, Benzinga observed back in April that Apple experienced a bearish engulfing at the peak of its chart, a signal that a stock may have topped.
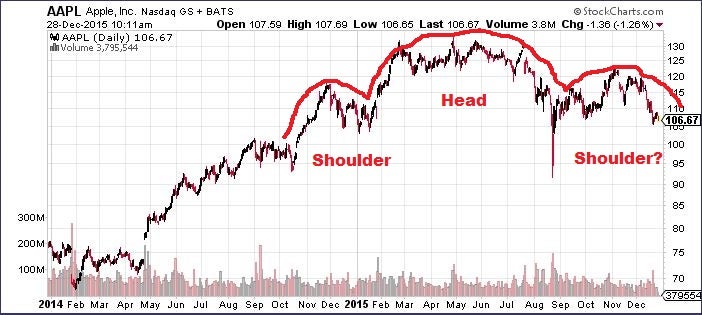
To make matters worse, Apple’s 2015 trading seems to have formed a head and shoulder pattern, another notoriously bearish technical formation that indicates the end of a long-term uptrend.
Frustrating Timing
For Apple shareholders, the bearish chart is…
Click here to continue reading
Want to learn more about how to profit off the stock market? Or maybe you just want to be able to look sophisticated in front of your coworkers when they ask you what you are reading on your Kindle, and you’d prefer to tell them “Oh, I’m just reading a book about stock market analysis,” rather than the usual “Oh, I’m just looking at pics of my ex-girlfriend on Facebook.” For these reasons and more, check out my book, Beating Wall Street with Common Sense. I don’t have a degree in finance; I have a degree in neuroscience. You don’t have to predict what stocks will do if you can predict what traders will do and be one step ahead of them. I made a 400% return in the stock market over five years using only basic principles of psychology and common sense. Beating Wall Street with Common Sense is now available on Amazon, and tradingcommonsense.com is always available on your local internet!


