There are a countless number of metrics and chart indicators that technical analysts use to determine buy and sell signals in the stock market. One of the more popular tools available is Bollinger Bands.
Bollinger Bands were developed by famous trader John Bollinger. Bollinger bands consist of a dotted simple moving average (typically a 20-day average) and then a solid upper and lower boundary line plotted two standard deviations above and below the dotted line.
Technicians use a number of different Bollinger trading techniques, but here are three stocks that recently broke above their upper Bollinger boundary, a bullish short-term signal.
1. FXCM Inc FXCM 0.3%
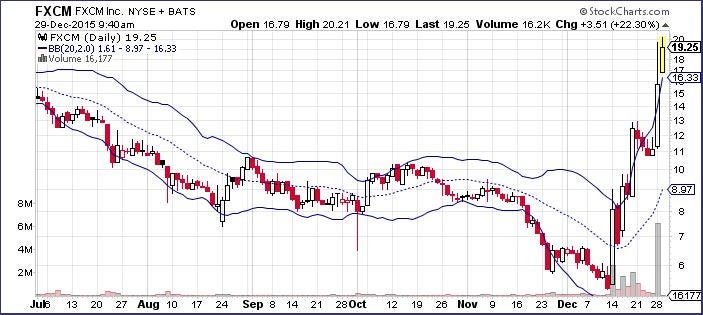
FXCM has had some major momentum since mid-December, and its push this week has it trading above its upper Bollinger Band. FXCM could soon be headed for a re-test of its post-crash high of $27.90 back in March.
2. SUPERVALU INC. SVU 1.89%
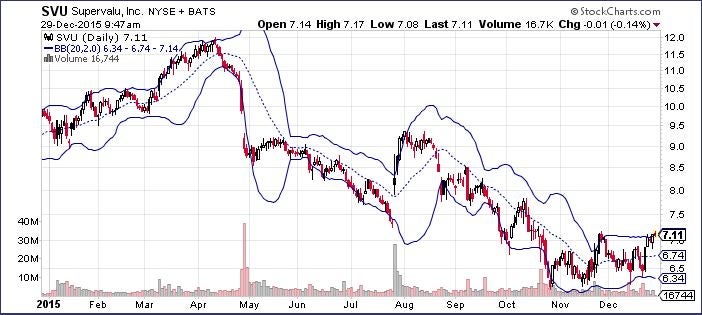
SUPERVALU shareholders are…
Click here to continue reading
Want to learn more about how to profit off the stock market? Or maybe you just want to be able to look sophisticated in front of your coworkers when they ask you what you are reading on your Kindle, and you’d prefer to tell them “Oh, I’m just reading a book about stock market analysis,” rather than the usual “Oh, I’m just looking at pics of my ex-girlfriend on Facebook.” For these reasons and more, check out my book, Beating Wall Street with Common Sense. I don’t have a degree in finance; I have a degree in neuroscience. You don’t have to predict what stocks will do if you can predict what traders will do and be one step ahead of them. I made a 400% return in the stock market over five years using only basic principles of psychology and common sense. Beating Wall Street with Common Sense is now available on Amazon, and tradingcommonsense.com is always available on your local internet!


