Last week, I read an article on CNN by Paul La Monica entitled “How to Stay Safe in a Scary Market.” In the article, La Monica says
So now’s the time… to be looking at blue chip, dividend-paying companies that can hold up well during rocky periods for the broader market.
The idea is that, when times get scary (as I have suggested they have become lately), you should build your portfolio around solid, low-volatility, low-risk stocks. I look at a lot of stock charts here on Trading Common Sense, and hopefully by using a little bit of common sense it’s easy to identify which stocks are more volatile in certain cases.
For example, take a look at this chart comparing Apple to Dynavax:
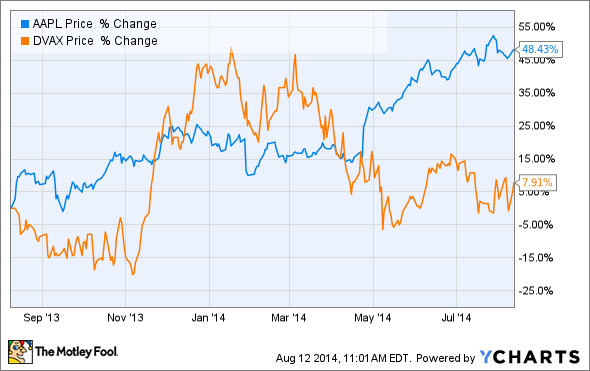
All it takes is a quick look at the “choppiness” of Dynavax’s share price compared to Apple’s to see that Dynavax is a more volatile stock.
But sometimes the contrast is not so obvious, and clearly “visual choppiness” is not a very well-defined means of differentiation.
So let’s first lay out what exactly we are looking for. We are looking for a measure of volatility. The S&P 500 index is a composite of all of its component stocks, meaning that when the S&P 500 moves x amount, many of its component stocks have moved greater than x amount, and many of them have moved less than x amount. What I’m looking for is a measure of how much more or less than the overall index a particular stock moves on the average day.
My wife is a scientist. I’m a scientist too, but she’s a scientist scientist. And in science, you are always trying to determine how things are related to each other. You collect a bunch of data about two variables, and the you look for a pattern. If you are looking at only two variables, you can plot your data points on a graph with one variable represented on the x-axis (such as time) and one variable on the y-axis (such as share price), and what you end up with looks just like a stock chart.
The next step for scientists often involves looking for a trend in the data. For example, you could end up with something that looks like this:
Which is a mess. Or, you could end up with something like this:
Which appears to have a pattern to it. This pattern indicates that your two variables likely have some sort of effect on each other, much like time has an effect on share price. But the next step in determining how strong that effect is. To do this, scientists and statisticians often use a technique called regression analysis.
I won’t get into too many of the gory details, but the idea behind regression analysis is that you take your data plot and you add a trend line to the plot. Then you determine how closely all of the data points fall to the trend line. The closer the data points fall to the trend line, the stronger the effect, or correlation, between the two variables.
When stock traders are looking at the volatility of stocks, we already have a beautifully-defined “trend line” to use for our regression analysis: the S&P 500 Index! How better to determine the “trend” of the stock market than to use a composite of its components? So to determine the volatility of a stock, we want to determine how closely the stock’s price fluctuations correlate to the changes in the S&P 500 Index.
This correlation between a particular stock and the S&P 500 is called beta. If you watch CNBC or Bloomberg TV at all, you’ve probably heard the talking heads refer to “high-beta” or “low-beta” stocks. They are referring to volatility.
Again, I won’t get into too many details because, honestly, you don’t actually need to remember them all. But here’s an overview of how beta is calculated:
1. Determine the variance of the stock and the variance of the S&P 500 over a given period of time (one year, for example). The variance is a measure of how closely the movements of the charts resemble a linear trend line.
2. Determine the covariance between the stock and the S&P 500 over the same period. Covariance measures how much the stock and the S&P 500 move in tandem.
3. Divide the covariance by the variance, and that’s your beta.
Almost any website that includes stock metrics will include beta. I typically use finviz.com. Therefore, the most important thing to take away from this post is this:
A beta of 1 means that the stock has moved, on average, exactly the same amount (in percentage terms) on a daily basis as the overall market has over the past year. A beta of less than 1 means that the stock is less volatile than the overall market, and a beta of greater than 1 means that the stock is more volatile than the overall market.
If you are annoyed that you had to read 800 words to get to the two important sentences, listen up. There are far too may people in the market trading systems, using formulas, referencing numbers, citing books, and quoting people, and they have absolutely no idea what anything they are saying or doing actually means. Sure, you can memorize that two-sentence explanation of beta, but unless you actually understand what the number is telling you about a stock, you are powerless to use it in any meaningful way.
I hope to continue exploring the ideas of volatility and safety for the rest of this week.
Are you frustrated with how stock prices seem to move so randomly? Or maybe you just want to be able to look sophisticated in front of your coworkers when they ask you what you are reading on your Kindle, and you’d prefer to tell them “Oh, I’m just reading a book about stock market analysis,” rather than the usual “Oh, I’m just looking at pics of my ex-girlfriend on Facebook.” For these reasons and more, check out my book, Beating Wall Street with Common Sense. I don’t have a degree in finance; I have a degree in neuroscience. You don’t have to predict what stocks will do if you can predict what traders will do and be one step ahead of them. I made a 400% return in the stock market over five years using only basic principles of psychology and common sense. Beating Wall Street with Common Sense is now available on Amazon, and tradingcommonsense.com is always available on your local internet!

