It’s easy for any trader keeping up with the daily moves of certain stocks and watching short-term catalysts to lose sight of the big picture. That’s why it’s important to take a step back from time to time and remember exactly what’s going on from a historical perspective. Here are eight charts that tell the story of what’s going on with the S&P 500 right now.
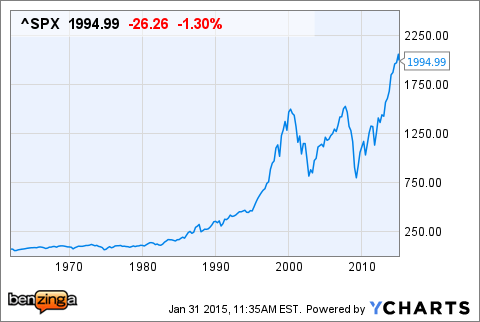
The first chart is the simplest, yet it is very important. While the 3 percent drop the market sustained in January can be fright-inducing, just look at where it stands in the longer term.
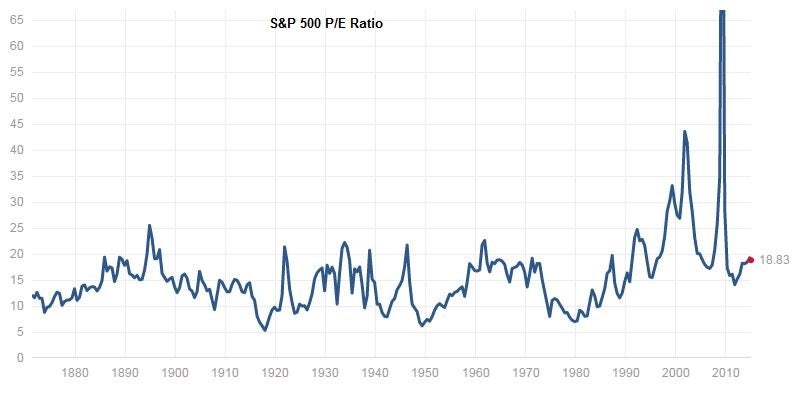
The price to earnings ratio of the market (PE) is currently at 18.8, above its historical average. However, it’s actually on the low end of its range since about 1990.
This next graph is where it starts to get troubling. This graph is Robert Shiller’s inflation-adjusted 10-year trailing PE for the market. It has only been this high three other times in history: prior to the Great Depression, prior to the bursting of the dot com bubble and prior to the recent financial crisis.
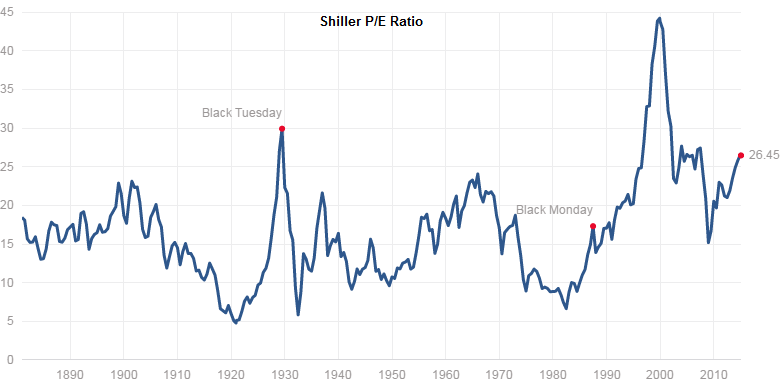
This graph is another look at the Shiller PE ratio, showing that the ratio has only been higher than its current level 6 percent of the time in the market’s history.
A look at forward PE and the price to earnings to growth ratio (PEG) of the S&P 500 reveals that the forward PE of 16.4 is at its highest point in over a decade, and the market’s PEG of 1.5 is near peak levels during the financial crisis.
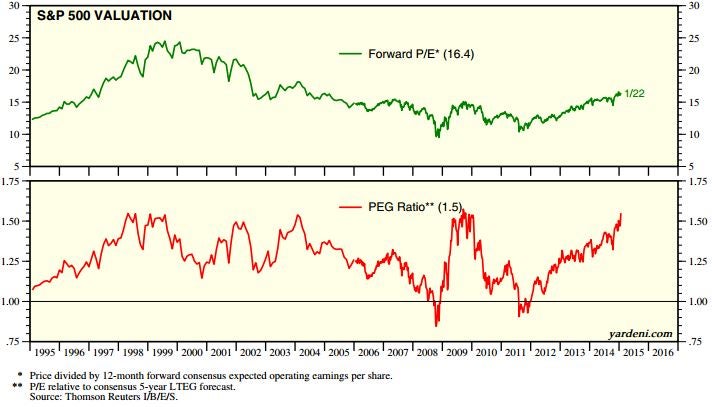
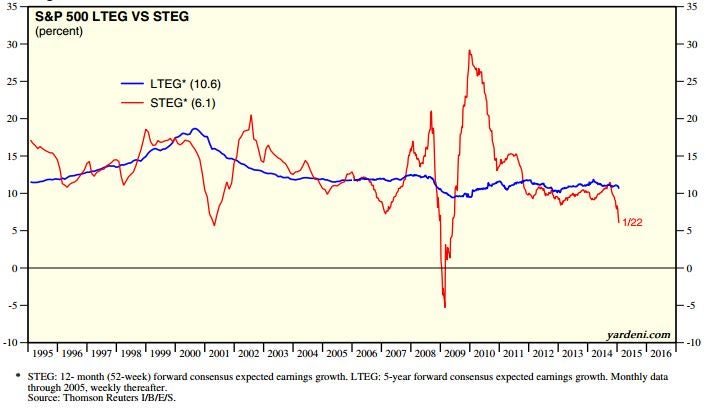
Five-year consensus earnings growth projections are stable, but one-year growth projections are at their lowest level since 2009.
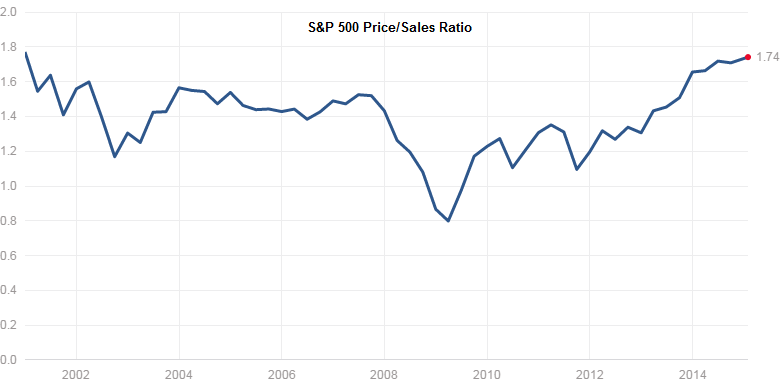
The S&P 500 price to sales ratio is also sitting at its highest point in over a decade at nearly 1.8.
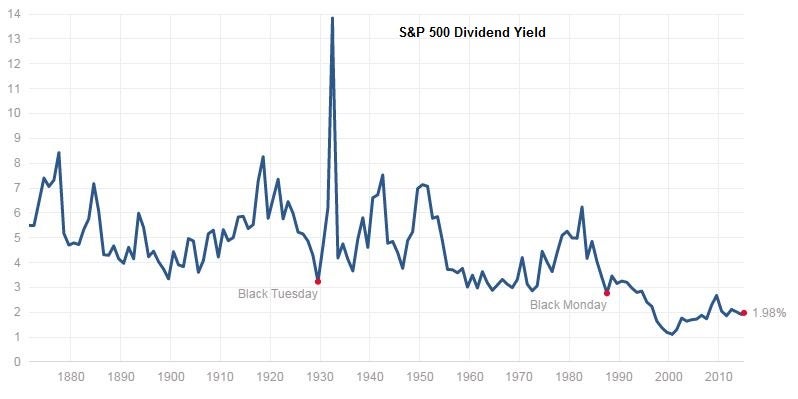
The market’s current dividend yield of about 2 percent is a reasonable level given the extremely low interest rate environment, but it is well below the historical mean of 4.4 percent.
The stock market moves in cycles, and it’s always important for investors not to lose sight of where the S&P 500 is in its current cycle. Sometimes a look into the past is the best way to predict the future.
Read this article and all my other articles for free on Benzinga by clicking here
Want to learn more about the stock market? Or maybe you just want to be able to look sophisticated in front of your coworkers when they ask you what you are reading on your Kindle, and you’d prefer to tell them “Oh, I’m just reading a book about stock market analysis,” rather than the usual “Oh, I’m just looking at pics of my ex-girlfriend on Facebook.” For these reasons and more, check out my book, Beating Wall Street with Common Sense. I don’t have a degree in finance; I have a degree in neuroscience. You don’t have to predict what stocks will do if you can predict what traders will do and be one step ahead of them. I made a 400% return in the stock market over five years using only basic principles of psychology and common sense. Beating Wall Street with Common Sense is now available on Amazon, and tradingcommonsense.com is always available on your local internet!


