There was a lot of surprising headlines and major market moves in the tech world this earnings season. Now that most of the big names have reported and the dust has settled, it’s a good time to take a look at how some of the big names compare on market fundamentals.
Here’s a breakdown of how Amazon.com Inc (NASDAQ: AMZN), Google Inc (NASDAQ: GOOG) (NASDAQ: GOOGL), Facebook Inc (NASDAQ: FB), Apple Inc (NASDAQ: AAPL) and Netflix Inc (NASDAQ: NFLX) look from a fundamental standpoint now that their latest earnings numbers are factored in.
Earnings
One of the most basic fundamental metrics for gauging a stock’s value is the price to earnings ratio (PE). The lower the PE, the higher the value. Here’s a breakdown of the updated PE for these five big names.
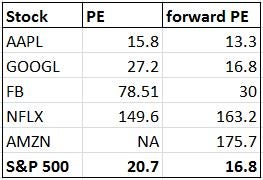
Apple is currently the only stock of the five with a PE lower than the S&P 500’s overall PE of 20.7. Facebook and Netflix’s PEs of over 75 are well out of the typical range. Amazon is the only company that was not profitable over the last four quarters (and therefore has no PE).
Growth
However, price is not everything.
Growth rate is also critical for companies that are rapidly increasing their bottom lines. The price to earnings to growth ratio is a good way to look at how expensive a stock is relative to its growth rate. Here’s a comparison of the PEGs of these five names.

Again, Apple is the only stock with a PEG lower than the overall market. Google’s 19 PEG is fairly high, and Facebook and Netflix’s PEGs are much higher than the S&P average. Amazon’s PEG cannot be calculated from its negative earnings.
Cash Flow
Sometimes when companies reinvest a majority of earnings for the purpose of expanding operations and growing the company, earnings numbers aren’t the best measure of a stock’s value.
Instead, investors may choose to focus on cash flow from operations, a measure of how much cash a company brings in from regular business activities. Here is the price to cash flow from operations ratio for each of these five companies.
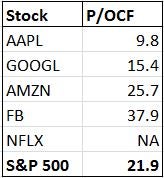
Apple makes it a clean sweep, coming in with the best cash flow valuation as well.
Amazon and Facebook both have relatively high cash flow valuations, and Netflix’s ratio cannot be calculated because it has negative operating cash flow during the past four quarters.
Takeaway
All five of these tech giants have generated a large amount of buzz and excitement on Wall Street in recent years.
However, despite the companies’ ground-breaking technological innovations, it’s always important for investors to know and understand the underlying fundamentals of the stocks.
Cash flow numbers calculated from here: http://www.marketwatch.com/investing/stock/FB/financials/cash-flow/quarter
Earnings ratios from finviz.com.
Market averages here: http://www.zerohedge.com/sites/default/files/images/user3303/imageroot/2015/07/20150721_BAML1.jpg
Read this article and all my other articles for free on Benzinga by clicking here
Want to learn more about the stock market? Or maybe you just want to be able to look sophisticated in front of your coworkers when they ask you what you are reading on your Kindle, and you’d prefer to tell them “Oh, I’m just reading a book about stock market analysis,” rather than the usual “Oh, I’m just looking at pics of my ex-girlfriend on Facebook.” For these reasons and more, check out my book, Beating Wall Street with Common Sense. I don’t have a degree in finance; I have a degree in neuroscience. You don’t have to predict what stocks will do if you can predict what traders will do and be one step ahead of them. I made a 400% return in the stock market over five years using only basic principles of psychology and common sense. Beating Wall Street with Common Sense is now available on Amazon, and tradingcommonsense.com is always available on your local internet!


