With a population of 1.2 billion and a GDP growth rate more than twice the U.S. rate, India presents banking opportunities unlike anything seen in America. Does that mean that Indian banks are a better investment right now than their American counterparts?
Let’s take a look at how Indian banking leaders ICICI Bank (NYSE: IBN ) and HDFC Bank Ltd. (NYSE: HDB ) stack up against one of the largest U.S. banks, Wells Fargo & Company (NYSE:WFC ) .
Performance
Let’s start off by taking a look at the operations of the three banks. By comparing the return on equity (ROE), we can see how efficiently the companies are generating profits from equity.

I always look for ROE over 10%, and I consider Wells Fargo’s 14.1% ROE to be quite strong. However, both of the Indian banks have impressive ROEs of their own, with HDFC leading the pack at 16.8%.
Next, let’s compare net interest margin (NIM). NIM is calculated by subtracting the interest a bank pays on its deposits and debt from the interest it earns on its loans and securities. That difference is then divided by the value of the loans and securities to produce the NIM.
NIM for banks typically ranges from 3% to 4%, but the higher the better.

While Wells Fargo and ICICI’s numbers certainly fall within the normal range, HDFC’s NIM of 4.4% outpaces the other banks and indicates that HDFC is generating some impressive profits from its assets.
Valuation
While HDFC has jumped out to an early lead in our comparison, there’s a lot more that goes into evaluating a bank stock than company performance alone. As a Wells Fargo shareholder, I’m a fan of the stock’s current valuation, but let’s take a look at how ICICI and HDFC stack up.
| Company |
Total Assets ($billions) |
P/TBV | BVPS Growth |
|---|---|---|---|
| Wells Fargo | 1547 | 2.3 | 10.2% |
| ICICI Bank | 99 | 2.4 | 5.4% |
| HDFC Bank | 76 | 5.4 | 10% |
Although the two Indian banks are both large-cap companies, Wells Fargo has nearly nine times the total assets as ICICI and HDFC combined! From a valuation perspective, ICICI’s price to tangible book value (P/TBV) of 2.4 is right in line with Wells Fargo’s value of 2.3, but HDFC’s 5.4 P/TBV suggests that the stock currently carries a steep price tag.
When comparing the growth of the banks, it’s HDFC that is on par with Wells Fargo, as both companies have 5-year book value per share (BVPS) annual growth rates above 10%. In this instance, ICICI is the laggard with only a 5.4% annual growth rate.
Risk
With the stellar ROE of the two Indian banks and HDFC’s spectacular 4.4% NIM, we certainly need to look for red flags indicating possible risky behavior. There is no guaranteed way to determine the risk on a bank’s balance sheet, but there are a couple of simple numbers I like to check to get a feel for the risk level of a bank’s operations.
The first thing I want to see when I look at a bank’s balance sheet is that a large portion of its assets consist of loans rather than securities. A lot of securities on a balance sheet isn’t necessarily a bad thing, but loans are typically simple and safe compared to whatever mysterious “securities” a bank might be holding.

Ideally, I would like to see loans making up 80% or more of assets because that would indicate that the bank is operating almost exclusively as a traditional lender.
However, these three large banks all seem to have their fair share of non-loan assets, with HDFC having the highest percentage of loans at just over 61%.
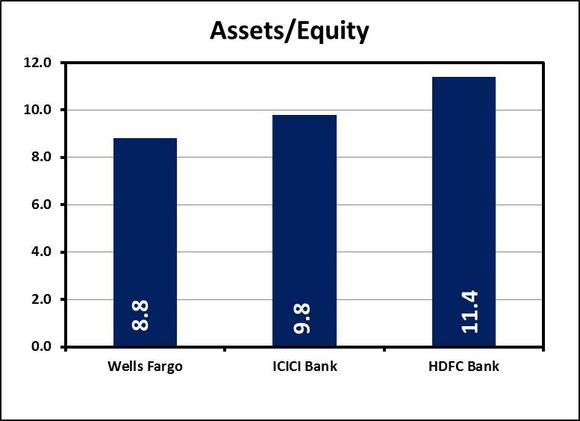
The next place I want to check for risky behavior is the assets/equity ratio. This number gives a rough estimate of how prepared the bank is to handle a downturn in the economy. In fact, the largest U.S. banks must undergo an annual stress test by the Federal Reserve that specifically looks at the equity levels. I’m looking for an asset/equity ratio under 10, but the lower the number the better.

Thanks in large part to the Federal Reserve, Wells Fargo wins this contest at 8.8. ICICI’s ratio of 9.8 barely sneaks in under my threshold, but HDFC’s ratio of 11.4 indicates that it is likely not as well-positioned to handle economic turmoil as the other two banks.
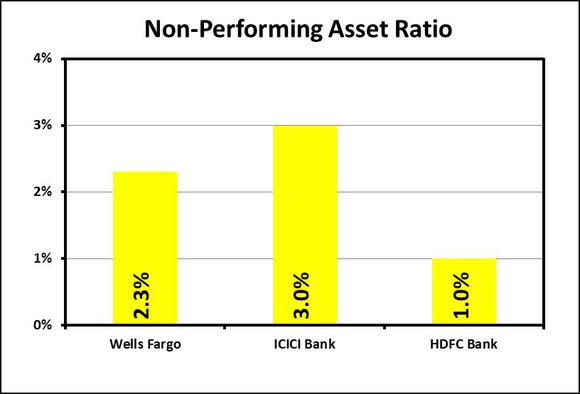
Finally, I want to check for risk in the non-performing assets (NPA) ratio. This ratio is simply the percentage of the bank’s total loans that are delinquent. Clearly we’re looking for as small a number as possible here, but under 1% would be ideal.

HDFC passes the NPA test with flying colors. While Wells Fargo’s ratio of 2.3% is not great, ICICI’s ratio of 3% might be cause for concern.
Is it time to invest in India?
After using these basic metrics to get a rough overview of these three banks, I’m not convinced that either ICICI or HDFC is a can’t-miss investment at this time. ICICI has a strong ROE and a reasonable valuation, but its growth rate and non-performing asset ratio fall short of where they should be.
HDFC appears to be the stronger of the two Indian banks with its stellar ROE, impressive NIM, and tiny non-performing asset ratio. But with its stock already trading at over five times TBV, HDFC’s already looks overpriced.
Even though Wells Fargo didn’t produce stand-out numbers in any particular area we looked at, the company’s numbers are consistently solid across the board, and I see no obvious cause for shareholder concern. ICICI and HDFC both show some promise, but its Wells Fargo’s consistent position of strength that makes it my pick of the three.
I want to take a minute to thank all the people that bought my book this past weekend while it was on sale. I hope you enjoy reading.
Does the market seem completely random to you sometimes? Trust me: it’s not. Or maybe you just want to be able to look sophisticated in front of your coworkers when they ask you what you are reading on your Kindle, and you’d prefer to tell them “Oh, I’m just reading a book about stock market analysis,” rather than the usual “Oh, I’m just looking at pics of my ex-girlfriend on Facebook.” For these reasons and more, check out my book, Beating Wall Street with Common Sense. I don’t have a degree in finance; I have a degree in neuroscience. You don’t have to predict what stocks will do if you can predict what traders will do and be one step ahead of them. I made a 400% return in the stock market over five years using only basic principles of psychology and common sense. Beating Wall Street with Common Sense is now available on Amazon, and tradingcommonsense.com is always available on your local internet!

