There’s no doubt about it: Apple Inc. AAPL 0.97%’s technical picture has been pretty bearish in the past couple of months. However, the stock is now in danger of things getting a lot worse.
Benzinga first reported about a bearish technical signal in Apple’s carts on April 29 of 2015, immediately after the stock hit all-time highs of $131.29. In just over a year since that story, Apple’s shares have fallen nearly 30 percent.
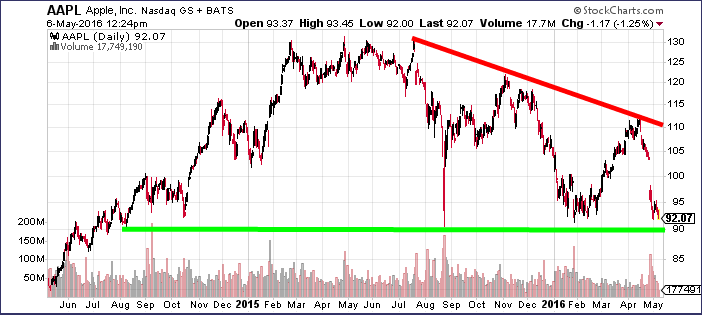
The stock’s post-earnings sell-off now has it once again testing its 2015 flash crash lows of around $90. Apple has repeatedly found technical support in this region in the past couple of years, including during the early 2016 market selloff. A breakdown below $90 would be a significantly bearish signal for Apple traders.
In the longer-term, however, Apple bulls remain optimistic that Apple simply got overheated and is repeating the roughly 40 percent pullback it experienced in 2012-2013. If that’s the case, the stock could dip…
Click here to continue reading
Want to learn more about how to profit off the stock market? Or maybe you just want to be able to look sophisticated in front of your coworkers when they ask you what you are reading on your Kindle, and you’d prefer to tell them “Oh, I’m just reading a book about stock market analysis,” rather than the usual “Oh, I’m just looking at pics of my ex-girlfriend on Facebook.” For these reasons and more, check out my book, Beating Wall Street with Common Sense. I don’t have a degree in finance; I have a degree in neuroscience. You don’t have to predict what stocks will do if you can predict what traders will do and be one step ahead of them. I made a 400% return in the stock market over five years using only basic principles of psychology and common sense. Beating Wall Street with Common Sense is now available on Amazon, and tradingcommonsense.com is always available on your local internet!


