In light of the recent turbulence in the stock market, I thought today I could take a quick look at few key technical levels to be watching in the S&P 500, the Dow Jones Industrial Average, and some of the stocks I hold or have recently discussed.
First, let’s take a look at Apple:
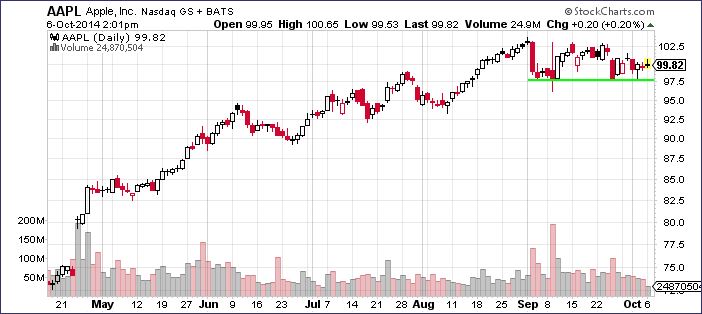
Fort all the doom and gloom in the market lately, Apple has been holding up surprisingly well. For now, it looks to be getting some upward buying pressure every time it starts to approach $97.50. That might be an important level to keep an eye on if the market starts to go south in upcoming days.
Now a quick look at Bank of America:
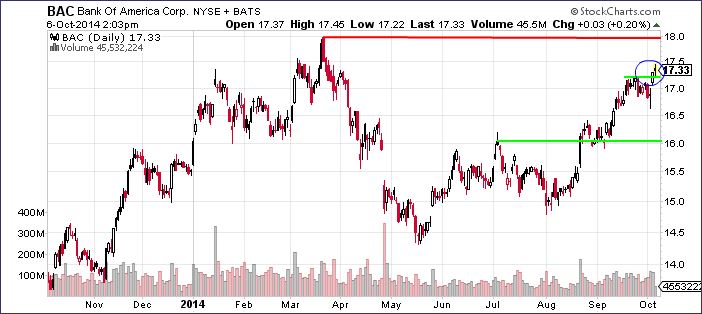
Last week, UBS upgraded Bank of America and set a $20 price target on the stock. It’s not surprising to see that BAC is another stock that held up relatively well during the recent market pullback. In fact, with a solid foundation of support at around $16, BAC seems to be breaking out above a previous resistance line at $17.20 or so (blue circle). The way it’s looking, if the overall market holds up in the next few weeks, I wouldn’t be surprised to see Bank of America test its 52-week high of around $18 soon.
Now let’s move to Wells Fargo‘s chart:
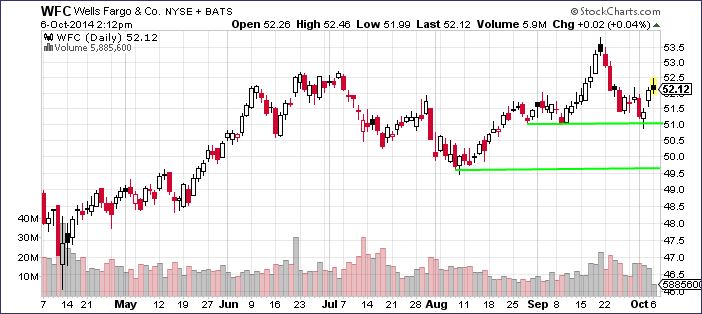
Wells Fargo is still looking good for now. I drew two technical support levels on the chart, one at around $51.00 and another at around $49.80. The one at $51.00 was briefly tested twice on very small pullbacks in late August and early September, and the stock bounced off of that level last week. While $51.00 might hold for WFC, the $49.80/$50-ish level would be the more important one to watch in terms of a potential reversal. As long as Wells Fargo stays above $50, the technicals still look just fine to me.
The last stock I want to look at today is another one of my favorites, but for a different set of reasons. Amazon is an interesting case and an interesting chart:
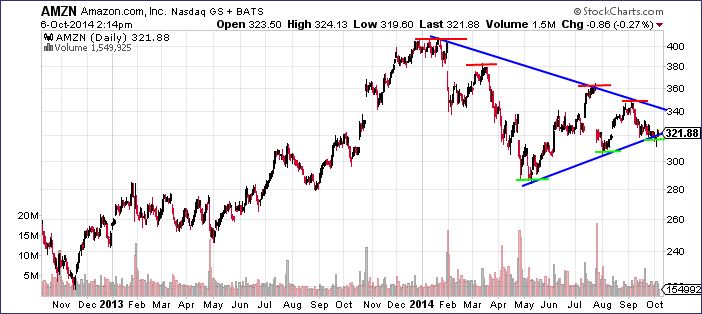
Technical analysis has nothing to do with why I’m short Amazon. But the chart is forming a very clear pennant formation. When I wrote last week about recognizing trends in stock charts, I talked about an uptrend being defined by a series of higher peaks and higher troughs and a downtrend being defined by a series of lower peaks and lower troughs. But Amazon is showing something different all together: lower peaks (red) and higher troughs (green). Common sense should tell you that this formation cannot continue forever, and the pennant formation will eventually “pinch” the stock into breaking either up or down. Right now, that “breakout” for Amazon would be below around $315 or above around $340.
Last but certainly not least is the S&P 500 itself. When I last discussed trends, I used this chart to show the market’s current uptrend:
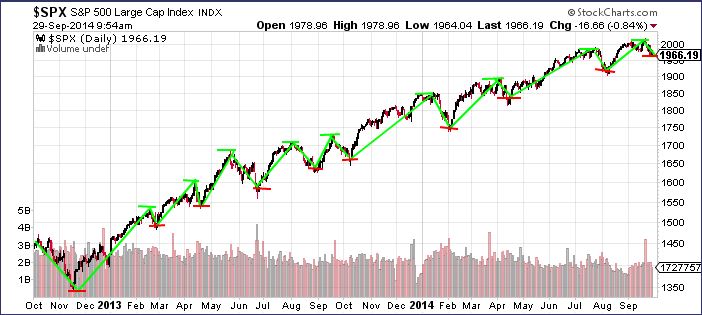
Since that post, the S&P dipped all the way down to 1926 before bouncing back to 1968.
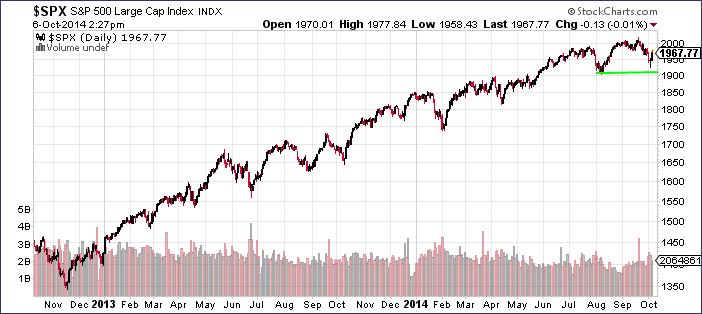
The market has certainly been volatile lately, but until the S&P 500 breaks below 1900, it’s just business as usual for investors like me who enjoy the perks of a long-term perspective.
Want to learn more about the psychology of the stock market? Or maybe you just want to be able to look sophisticated in front of your coworkers when they ask you what you are reading on your Kindle, and you’d prefer to tell them “Oh, I’m just reading a book about stock market analysis,” rather than the usual “Oh, I’m just looking at pics of my ex-girlfriend on Facebook.” For these reasons and more, check out my book, Beating Wall Street with Common Sense. I don’t have a degree in finance; I have a degree in neuroscience. You don’t have to predict what stocks will do if you can predict what traders will do and be one step ahead of them. I made a 400% return in the stock market over five years using only basic principles of psychology and common sense. Beating Wall Street with Common Sense is now available on Amazon, and tradingcommonsense.com is always available on your local internet!

