The iShares Barclays 20+ Yr Treas.Bond (ETF) TLT 0.46% has broken out to new all-time highs in June. However, the ETF’s chart indicates the run-up may be on a breather for the time being.
After forming a double top at $134 in early 2015 and early 2016, TLT broke through the $134 level with authority earlier this month and surged to new all-time highs.
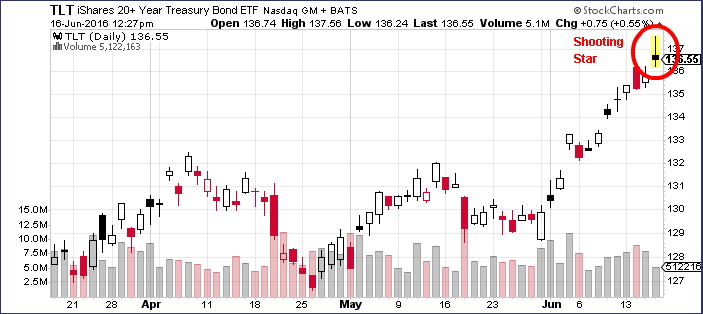
The ETF climbed as high as $137.56 in Thursday morning trading before pulling back to the mid-$136 range.
The bad news for TLT bulls is that the ETF may be forming a shooting start technical formation on Thursday. A shooting star is a candlestick formation that forms when a stock or ETF advances well above its opening price throughout the trading day only to pull back and close below the opening price. This formation typically marks near-term market tops and reversals.
If the TLT’s current price holds, the ETF will form…
Click here to continue reading
Want to learn more about how to profit off the stock market? Or maybe you just want to be able to look sophisticated in front of your coworkers when they ask you what you are reading on your Kindle, and you’d prefer to tell them “Oh, I’m just reading a book about stock market analysis,” rather than the usual “Oh, I’m just looking at pics of my ex-girlfriend on Facebook.” For these reasons and more, check out my book, Beating Wall Street with Common Sense. I don’t have a degree in finance; I have a degree in neuroscience. You don’t have to predict what stocks will do if you can predict what traders will do and be one step ahead of them. I made a 400% return in the stock market over five years using only basic principles of psychology and common sense. Beating Wall Street with Common Sense is now available on Amazon, and tradingcommonsense.com is always available on your local internet!


