One of the most common technical analysis tools that traders use is the simple moving average (SMA). In fact, when you create a stock’s bar chart, the 50-day SMA and the 200-day SMA, two of the most commonly-used SMAs, are often included by default.
As the name implies, a moving average line is simply a line that represents the mean average of a stock’s price over a set number of intervals. For example, the 50-day SMA on a daily chart will be a line that represents the average share price of the stock over the past 50 days. There is nothing inherently special about 50 and 200 days, but traders typically prefer to compare a shorter-term line with a longer-term one.
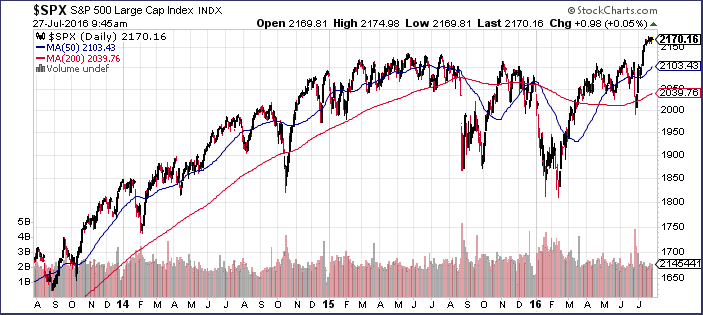
In the chart below of the S&P 500, the 50-day SMA is the blue line and the 200-day SMA is the red line.
Technical traders tend to use a stock’s current share price in coordination with its 50-day SMA and its 200-day SMA to determine a stock’s trend. Because the SMA’s are averages over an extended period of time, they represent smoothed trend lines that can eliminate much of the noise of daily trading.
If a stock is trading above its 50-day SMA, it is typically in a short-term uptrend. If the 50-day SMA is higher than the 200-day SMA, it is typically a sign of a longer-term uptrend.
As you can see, during the extended S&P 500 uptrend from 2013 through the middle of 2015, the S&P 500 spent a large amount of time above its 50-day SMA, but the 50-day SMA stayed above the 200-day SMA the entire time.
When the 50-day SMA crosses above the 200-day SMA, the lines form what’s known as a “golden cross.” Some traders use this event as a buy signal and an indication of the beginning of a long-term uptrend. When the 50-day SMA crosses below the 200-day SMA, it forms a “death cross.” As the name implies, technical analysts see this formation as a bearish sign and a sell signal.
In addition, the SMAs themselves often serve…
Click here to continue reading
Want to learn more about how to profit off the stock market? Or maybe you just want to be able to look sophisticated in front of your coworkers when they ask you what you are reading on your Kindle, and you’d prefer to tell them “Oh, I’m just reading a book about stock market analysis,” rather than the usual “Oh, I’m just looking at pics of my ex-girlfriend on Facebook.” For these reasons and more, check out my book, Beating Wall Street with Common Sense. I don’t have a degree in finance; I have a degree in neuroscience. You don’t have to predict what stocks will do if you can predict what traders will do and be one step ahead of them. I made a 400% return in the stock market over five years using only basic principles of psychology and common sense. Beating Wall Street with Common Sense is now available on Amazon, and tradingcommonsense.com is always available on your local internet!


