A decade after the height of the U.S. housing bubble, the impact of its collapse is still playing out in the U.S. market. The graph below shows how the percentage of Americans that own homes and the percentage of Americans that rent housing have changed since 2000.
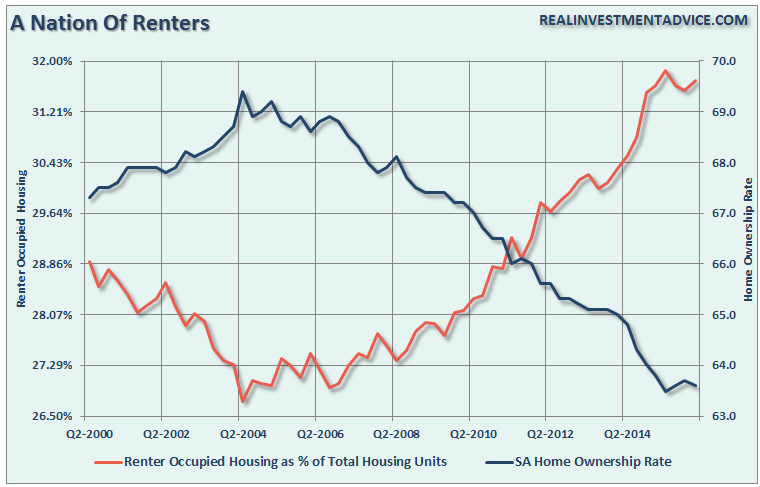
Home ownership rates peaked at above 69 percent in 2004 before beginning a steady decline that has continued into 2016. The home ownership rate now sits at just above 63.5 percent.
Renter-occupied housing, however, bottomed out at around 27 percent in 2004 and has since steadily increased to nearly 32 percent.
Even though the housing market has improved in recent years, the rising number of renters has driven up rental prices. From 2000 to 2014, rent prices rose about 3.0 percent, roughly doubling the 1.5 percent pace of inflation in that time.
The housing bubble and its fallout still have many Americans leery of buying a house.
“We went…
Click here to continue reading
Want to learn more about how to profit off the stock market? Or maybe you just want to be able to look sophisticated in front of your coworkers when they ask you what you are reading on your Kindle, and you’d prefer to tell them “Oh, I’m just reading a book about stock market analysis,” rather than the usual “Oh, I’m just looking at pics of my ex-girlfriend on Facebook.” For these reasons and more, check out my book, Beating Wall Street with Common Sense. I don’t have a degree in finance; I have a degree in neuroscience. You don’t have to predict what stocks will do if you can predict what traders will do and be one step ahead of them. I made a 400% return in the stock market over five years using only basic principles of psychology and common sense. Beating Wall Street with Common Sense is now available on Amazon, and tradingcommonsense.com is always available on your local internet!


