A recent failed head and shoulders technical pattern in the S&P 500 has once again raised the age-old debate about whether technical chart patterns are actually useful to traders.
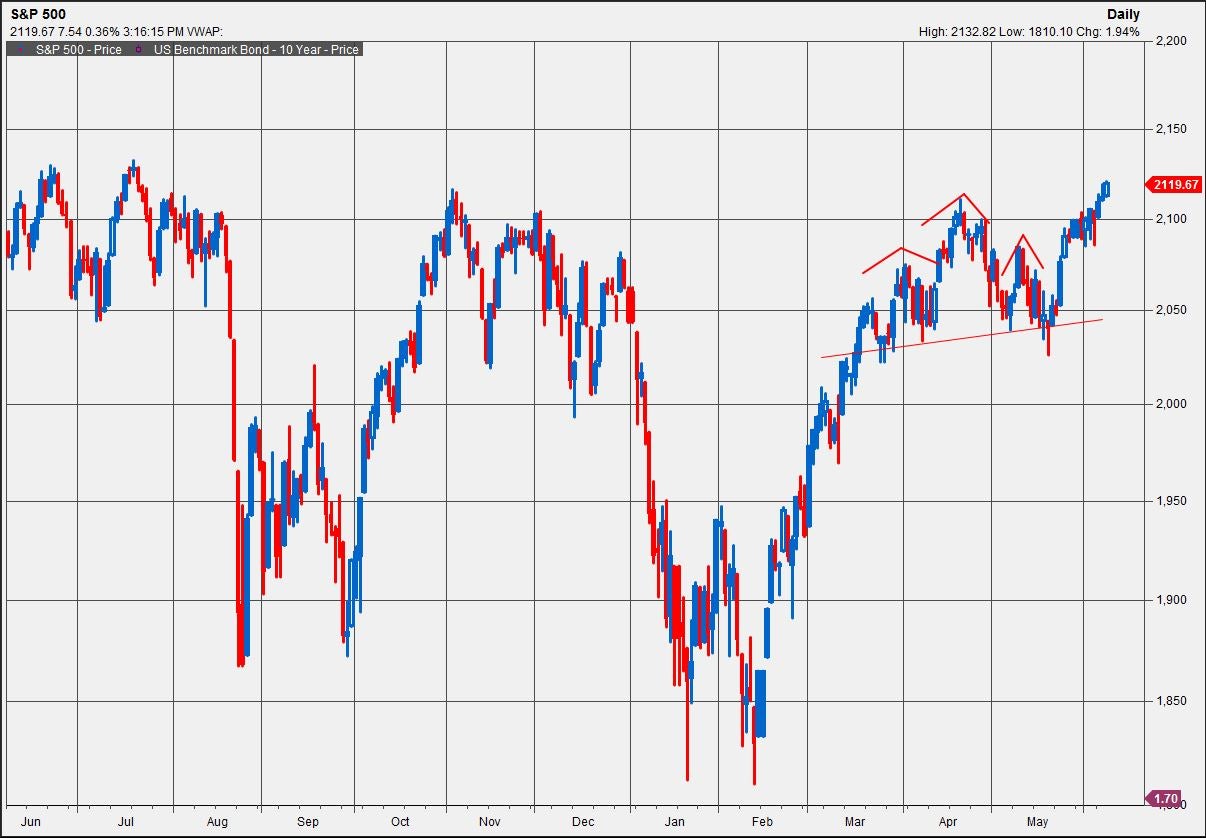
MarketWatch reported the bearish head and shoulders pattern that the S&P 500 formed from March to May was quickly followed by a breakout to new highs.
“Nowadays, chart patterns offer no direct edge simply because charts and related analysis are easily accessible,” author Michael Harris said.
Not ‘That’ Type Of Bear Trader
Insitnet LLC technical analyst Frank Cappelleri believes traders simply have to look for confirmation beyond a single pattern.
“When watching technical indicators we look across various indexes to make sure that a specific pattern is not isolated,” Cappelleri explained.
“Recent breakouts above April highs in small caps and mid caps confirmed that the S&P 500 is likely to break out as well.”
Bearish technical patterns such as a head and shoulders formation that break down quickly are…
Click here to continue reading
Want to learn more about how to profit off the stock market? Or maybe you just want to be able to look sophisticated in front of your coworkers when they ask you what you are reading on your Kindle, and you’d prefer to tell them “Oh, I’m just reading a book about stock market analysis,” rather than the usual “Oh, I’m just looking at pics of my ex-girlfriend on Facebook.” For these reasons and more, check out my book, Beating Wall Street with Common Sense. I don’t have a degree in finance; I have a degree in neuroscience. You don’t have to predict what stocks will do if you can predict what traders will do and be one step ahead of them. I made a 400% return in the stock market over five years using only basic principles of psychology and common sense. Beating Wall Street with Common Sense is now available on Amazon, and tradingcommonsense.com is always available on your local internet!


